Vital signs like blood pressure, oxygen saturation and body weight are measurable parameters that distinguish healthy individuals from those experiencing a medical problem. Blood pressure cuffs, pulse oximeters, and other handheld devices now generate thousands of data points, threatening to overwhelm clinicians who don’t have the infrastructure to analyze this volume of data.
Blood Pressure Monitors
Blood pressure monitors followed a similar trajectory. Home devices appeared in 1973, went digital by 1974, and by 2022 sat in over 30% of U.S. households—making them the most widely adopted non-wearable consumer health device. Patients with hypertension check their blood pressure a few times per week; heart failure patients weigh themselves and measure blood pressure daily, watching for the fluid overload signals that precede dangerous decompensation. Yet despite decades of home monitoring, the data rarely makes it into medical records as structured information. A patient might dutifully track their blood pressure in a notebook or smartphone app for months, then read the numbers aloud to their doctor during a visit while the physician manually types them into the chart. Remote patient monitoring programs exist—Medicare started reimbursing for them in 2018—but adoption remains limited. As of 2022, only 570,000 Medicare patients were enrolled in any remote monitoring program, covering all devices combined. The infrastructure exists to transmit blood pressure readings automatically from home to clinic, but the workflow, reimbursement complexity, and integration challenges mean most patients still operate in the old paradigm: measure at home, report by mouth, hope the doctor writes it down.
Continuous Glucose Monitors (CGM)
As an 8 year old in 1999, I remember watching my grandmother dutifully use her lancet to draw a drop of blood from her finger, put it on a testing strip, and then push that strip into a handheld monitor several times a day. In the 2000s, scientists were able to miniaturize biocompatible needle-type sensors to be inserted into interstitial fluid and advances in wireless technology allowed devices to stream data to smartphones. Abbott’s release of the FreeStyle Libre in 2018 - a much more accurate device compared to legacy CGMs with longer battery life - catalyzed adoption of CGMs. By 2021, 50% of type 1 diabetics in the US used CGMs and that proportion continues to increase.
What CGMs actually measure is electrical current created by a chain of electrochemical reactions. Interstitial glucose reacts with the glucose oxidase enzyme on the sensor to produce hydrogen peroxide, which is then oxidized at the CGM’s platinum-iridium working electrode to generate an electrical current proportional to the glucose concentration. Most CGMs typically record glucose every 5 minutes which results in 288 readings per day. From that data the following metrics are created:
Time in Range (TIR): Percentage of glucose measurements between 70-180 mg/dL. This has become the primary metric of diabetes management, with a target of >70% time in range.
Time Below Range (TBR): Percentage of glucose measurements <70 mg/dL (hypoglycemia) or <54 mg/dL (severe hypoglycemia).
Time Above Range (TAR): Percentage of glucose measurements >180 mg/dL (hyperglycemia) or >250 mg/dL (severe hyperglycemia).
Glucose variability: Highly variable measurements indicate poorly managed diabetes.
The standard for presenting CGM data to clinicians is called an Ambulatory Glucose Profile (AGP). The AGP aggregates at least one week’s worth of data into a single-page report. The key visualization tool is the Ambulatory Glucose Profile (AGP), adopted as the international standard in the mid-2010s. The AGP aggregates 7-14 days of CGM data into a single-page and allows clinicians to quickly identify nocturnal hypoglycemia, post-meal spikes, inadequate basal insulin coverage, and other key findings. Each AGP includes 1) a median glucose curve with percentile bands (aka modal day plot), 2) daily glucose profiles, 3) time-in-range statistics, and 4) trend analysis. The figure below shows an example.
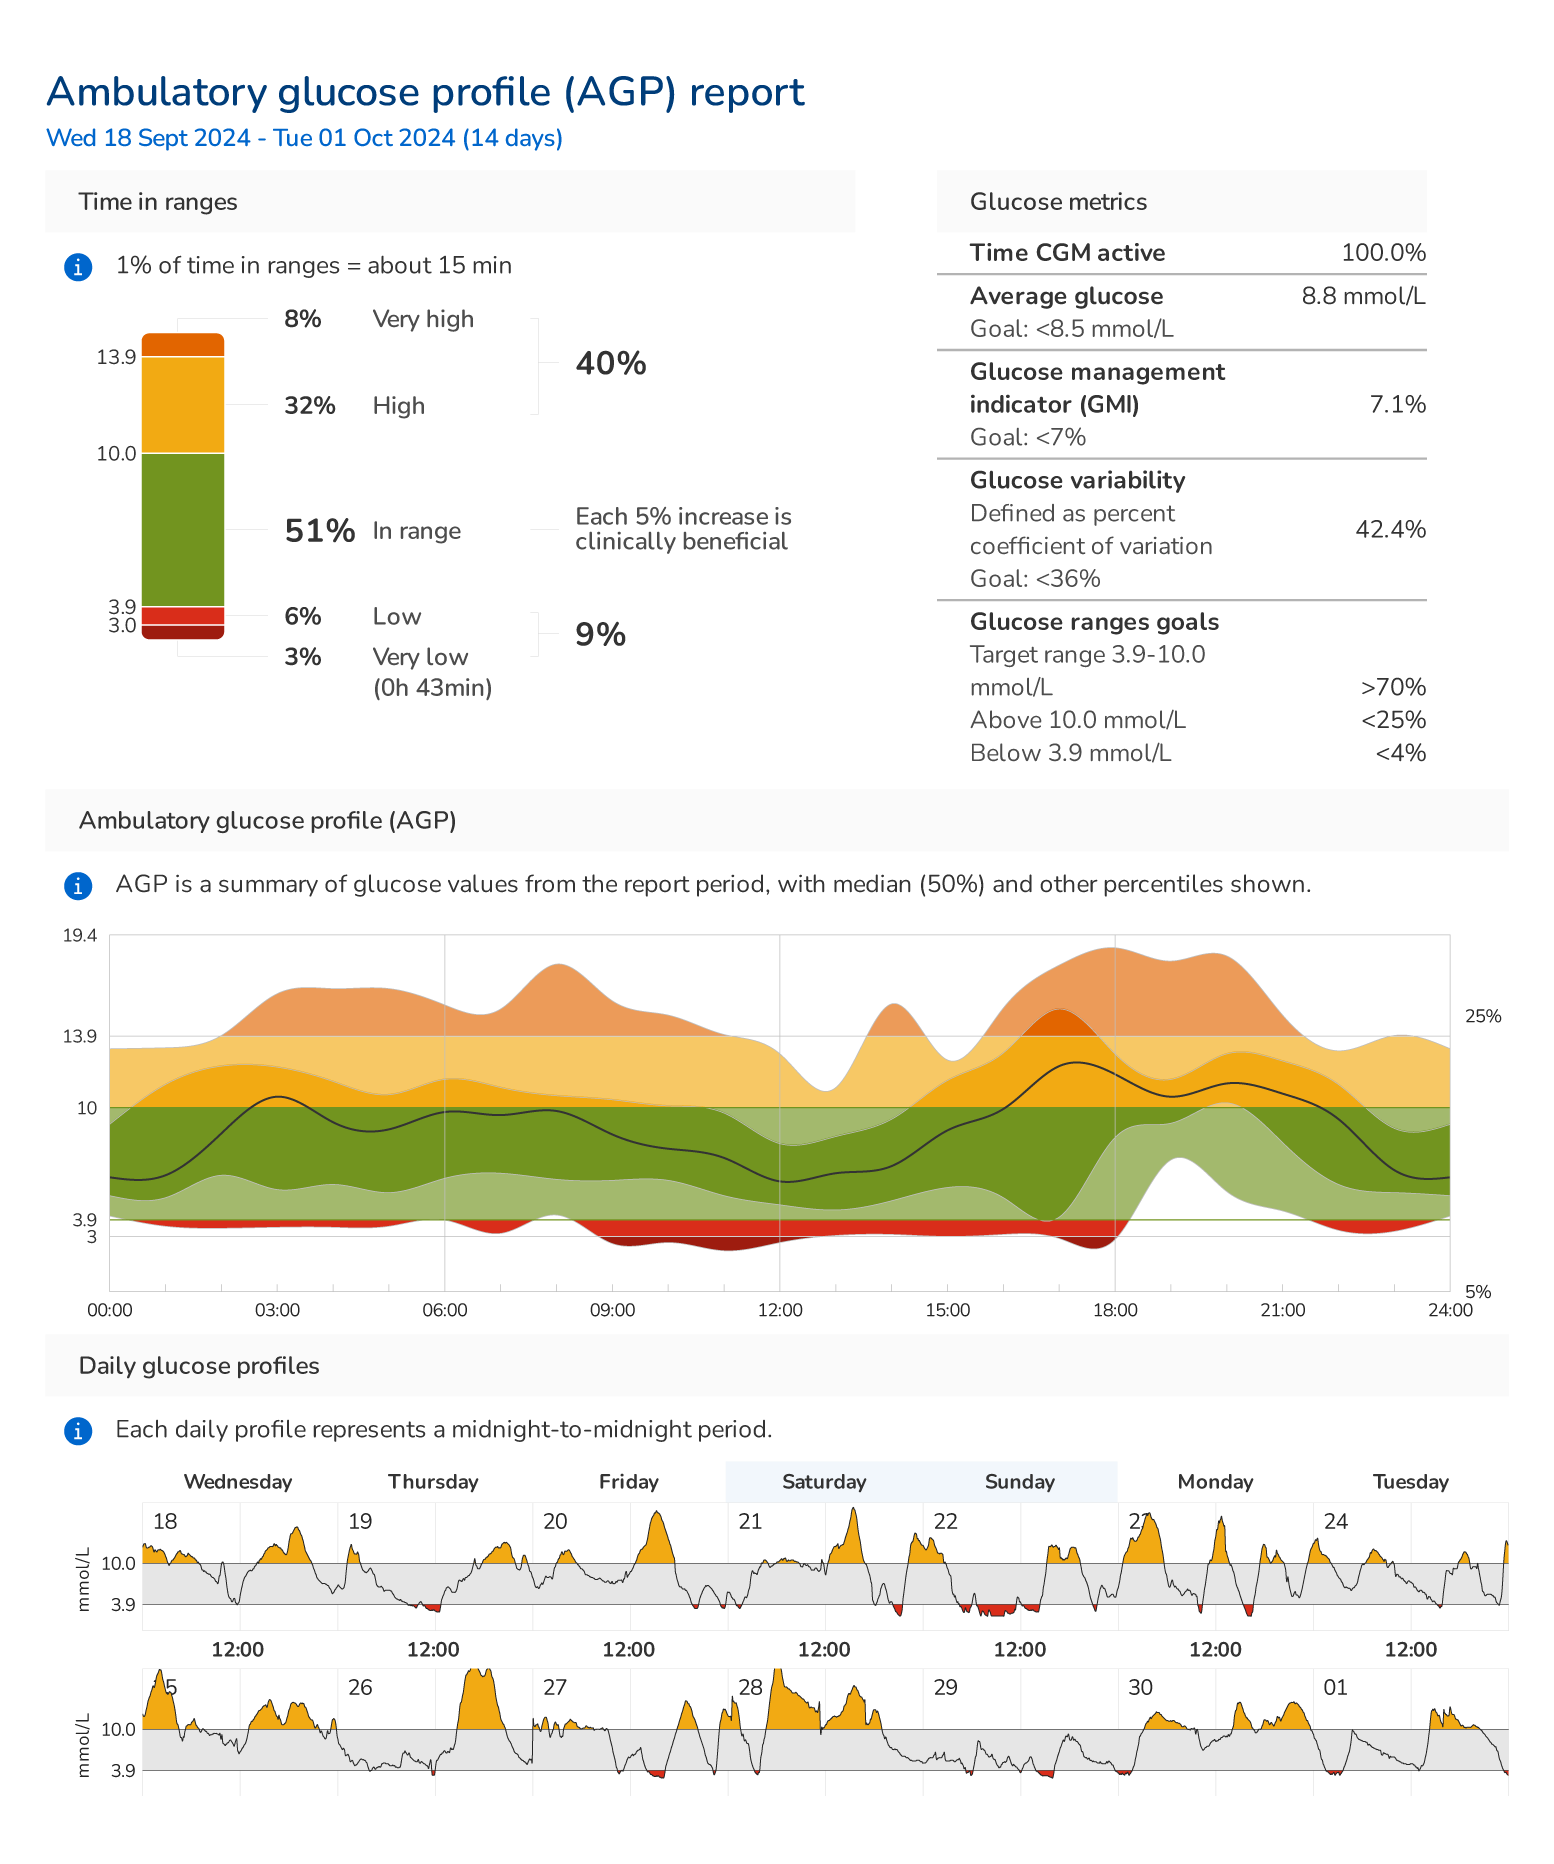
This standard presentation format replaced the chaotic practice of clinicians attempting to analyze thousands of data raw points. without drowning in data, which was critical to making CGM practical for both specialists and primary care providers.In very few cases does CGM data flow automatically into their medical records. Most clinicians who monitor this data do so via manufacturer-specific web portals like Decom Clarity, Abbot’s LibreView, or Medtronic’s CareLink. Some clinicians resort to taking screenshots of CGM reports and uploading them as images into the EHR, but this creates unstructured, unsearchable data that’s difficult to analyze or use for population health management. While the first formal standards for CGM-EHR integration were released in 2022 (the iCoDE report by The Diabetes Technology Society) in 2022, widespread adoption is years away.
Pulse Oximeters
Since its development in the 1980s, the pulse oximeter has been a non-invasive tool used by clinicians to monitor hospitalized patients. The low-cost and ease of use has led pulse oximeters to be increasingly used at home by patients managing chronic respiratory and cardiovascular conditions. Among patients with chronic obstructive pulmonary disease (COPD) and asthma, pulse oximeters are used to monitor lung functioning and inform clinicians about the effectiveness of treatment. Patients with heart failure might use their prescribed supply of supplemental oxygen if their SpO2 readings fall below a certain threshold. Sleep apnea is typically diagnosed and monitored at home and in sleep studies using a pulse oximeter. Unlike continuous glucose monitors, pulse oximetry typically involves infrequent measurement. Patients use their pulse oximeter a few times per day or whenever they are experiencing symptoms like shortness of breath or lightheadedness. Very seldom are pulse oximetry measurements transmitted into EHRs.
Electronic Scales for Monitoring Fluid Retention
Scales are no longer just meant for use in the home by folks wanting to drop a few pounds. Research has established that electronic scales will become a critical tool for monitoring chronic disease. Increasingly, electronic scales are being used to monitor possible dangerous fluid retention among patients with heart failure and kidney disease. A specialist will write their patient a prescription for a medical-grade electronic scale and instruct their patients to weigh themselves every morning after urinating but before eating. Any sudden weight gain (2-3 lbs per day or 5 lbs per week) signals fluid accumulation requiring immediate medical attention. This fluid retention might merit an increased oral diuretic dose (or IV diuretics) for a heart failure patient. For patients with kidney disease, fluid retention might suggest more frequent dialysis sessions or a modified dialysis protocol. Data from electronic scales are typically not ingested into EHR systems. If scale data leaves the device itself, it will be ingested into manufacturer-specific disease management platforms.
Cardiac Implantable Devices
Millions of Americans carry pacemakers, implantable cardioverter-defibrillators (ICDs), and cardiac resynchronization therapy devices (CRTs). Cardiac implantable devices track every heartbeat, detect arrhythmias like atrial fibrillation or ventricular tachycardia, and record when they intervene with pacing or shocks. These devices measure intracardiac electrograms (EGMs), which are similar to electrocardiograms (ECGs) but different in that they measure electrical signals from inside the body the (EGMs measure activity from outside the body). Because cardiac implantable devices have multiple leads installed on the surface of the heart, they record localized electrical activity in specific chambers. This data is then by the device to monitor, and if necessary, intervene.
In the context of these devices, the review of the recorded data by a clinician is called an interrogation. This can happen in the clinic when a medical technician extracts data from the implanted device or at the patient’s home via automated transmission from a bedside monitor to the device manufacturer’s cloud server. Most interrogations are routine checks showing normal device function with no arrhythmias, stable battery, and intact leads. The remaining 10% of interrogations detect clinically actionable findings like new atrial fibrillation requiring anticoagulation, inappropriate shocks needing device reprogramming, lead failures requiring hardware revision, or early heart failure signs from declining thoracic impedance that prompt medication adjustments. These interrogations might detect atrial fibrillation requiring anticoagulation, inaccurate shocks which demand the implantable device be recalibrated, or early heart failure signs that merit adjustments to a patient’s medications.
| Rhythm & Electrical Activity | Device Activity | Hemodynamic Sensors | Hardware Diagnostics |
|---|---|---|---|
| Heart rate (continuous, min, max, average) Atrial fibrillation episodes (count, duration, burden %) Ventricular tachycardia episodes Ventricular fibrillation episodes Premature ventricular contractions (PVCs) Intracardiac electrograms (actual waveforms). | Atrial pacing percentage Ventricular pacing percentage Biventricular pacing percentage (CRT devices) Shock deliveries (count, energy level, success/failure) Anti-tachycardia pacing (ATP) attempts Mode switching events | Minute ventilation Thoracic impedance (fluid status) Pulmonary artery pressure (CardioMEMS) Patient activity level/duration Rest periods Heart sounds (some newer devices) | Battery voltage Battery longevity estimate Atrial lead impedance Ventricular lead impedance Left ventricular lead impedance (CRT) Charge time (ICDs) Sensing thresholds Pacing thresholds |
Unfortunately clinicians have difficulty managing patients with cardiac devices due to data fragmentation across device manufacturers. Cardiologists have at least 3 different platforms to use (Medtronic, Boston Scientific, Abbott), each with different interfaces, alerting mechanisms, and data export formats. Large clinics might employ multiple staff dedicated to checking these disparate portals for alerts. Although some manufacturers offer FHIR APIs and major EHRs have cardiac device modules, the vast majority of clinicians review PDF reports attached to patient charts rather than structured time-series data. If the data were integrated into EHRs, clinicians could view device data alongside lab results, medications, and vital signs and receive automated alerts through the clinical decision support systems in their EHRs.