At the University of Colorado Hospital in Denver in the 1990s, the medical records department maintained a “records room” in the basement with 29 aisles of paper charts. That basement room held only about three years’ worth of charts and older records were stored off-site in a warehouse. Every day an average of 6 vertical feet of new records were generated and a staff of about fifty people worked full-time pulling, filing, sorting, and managing stacks of charts.
Compared to 30 years ago, today’s Electronic Health Records (EHRs) represent a vast improvement on the era of paper records. Healthcare providers today have faster access to information, improved continuity of care, and relief from the physical and administrative burden of paper-based documentation. However, many doctors find electronic health records frustrating because EHR interfaces are often poorly designed and frequent performance issues can inhibit productivity. A 2024 study found that more than one-quarter of clinicians report feeling dissatisfied with their EHR system.
A Day in the Life of An Electronic Patient Record
One of the first lessons that graduate students are taught in academic medical informatics progress is to consider the data generating process when working with data from EHRs. The best way to understand the content of electronic health records is to consider the data generating process. A routine outpatient visit without imaging might produce only a few megabytes of structured and unstructured data, while encounters involving medical imaging can generate hundreds of megabytes or even gigabytes - a single chest X-ray may be 15 megabytes, a 3D mammogram can be 300 megabytes, and a digital pathology file can be 3 gigabytes HealthTech. Regardless of volume, even a simple visit creates data that flows into dozens of different database tables, documents, and systems throughout the healthcare organization’s IT infrastructure.
Ambulatory Visit
Jasmine Williams, a 32-year-old software engineer, arrives at her primary care clinic for her annual wellness visit. She checks in at the front desk for her 10:00 AM appointment, updating her insurance information and confirming her contact details. After a brief wait, a medical assistant brings her back at 10:08 AM, where vital signs are collected: blood pressure 118/76, heart rate 68, temperature 98.4°F, height 5’6”, weight 142 lbs. The medical assistant enters all of the information into a computer terminal on wheels that she takes with her as she leaves the room and remarks that the doctor will be in shortly.
Dr. Martinez enters at 10:15 AM and introduces herself to Jasmine. Dr. Martinez sits on a rolling stool in front of a wall-mounted computer monitor, opens her ambient AI scribe app on her iPhone, selects ‘Record’ and then places the iPhone next to the computer keyboard, and then begins asking questions to Jasmine about her health. The patient reports no current concerns, takes no medications except occasional ibuprofen for menstrual cramps, and has no known allergies. She doesn’t consume alcohol, uses cannabis in edible form 2-3 times per week, doesn’t smoke tobacco, exercises 4-5 times weekly, and is sexually active with one partner with whom she uses oral contraceptives. Her family history is significant for type 2 diabetes in her father (diagnosed at age 58) and breast cancer in her maternal grandmother (at age 65). Dr. Martinez performs a physical exam for approximately 5 minutes and finds no abnormalities.
Dr. Martinez turns on the computer monitor, opens the Epic EHR, and navigates to the Orders tab within Jasmine’s chart. She searches for “Annual Physical Labs” in the order search bar, which brings up a pre-built order set titled “Adult Preventive Care Labs - Female (18-39)” that her practice has configured. Dr. Martinez clicks on the order set, which automatically selects the following tests as a bundle:
CBC with differential
Comprehensive metabolic panel (CMP)
Lipid panel
Hemoglobin A1c
TSH
The order set also has optional checkboxes for additional tests like Vitamin D, urinalysis, and STI screening, which Dr. Martinez leaves unchecked since they’re not indicated for Jasmine at this visit. She verifies the performing laboratory is set to Quest Diagnostics (the default for her practice), confirms the order priority is “Routine,” and notes that the orders are valid for 30 days.
Dr. Martinez adds “Family history of diabetes” as the indication for the HbA1c test in the free-text field. She reviews the order summary screen showing all five tests grouped together, then clicks “Sign Orders” at 10:28 AM. The orders are electronically transmitted to Quest Diagnostics and also generate a lab requisition that Jasmine can take to any Quest location. The system automatically creates pending result placeholders in the flowsheet for each test, which will populate when Quest sends results back via HL7 interface.
Later that evening, at 6:45 PM after finishing her patient appointments, Dr. Martinez reviews the ambient scribe’s AI-generated draft note on her computer using the web scribe’s web application. The draft has automatically populated the HPI, review of systems, physical exam template, and assessment/plan sections based on the recorded conversation. Dr. Martinez copies and pastes the note into the Epic Electronic Health Record and edits the note for accuracy, adds specific physical exam details that weren’t captured verbally (such as “peripheral pulses 2+ bilaterally”), verifies the family history coding is correct, and ensures the plan reflects her clinical reasoning. She signs and locks the note at 7:02 PM. The visit is coded as 99395 (preventive visit, 18-39 years) and closes without any diagnoses requiring ongoing management.
Summary of Data Created by Jasmine’s Office Visit
The clinical data from Jasmine’s preventive care visit is stored across multiple interconnected tables within Epic’s Clarity data warehouse, with structured information captured in relational database tables and unstructured clinical documentation stored separately. Below are
| Structured Data Epic Clarity Data Warehouse | PAT_ENC: 1 row added; includes basic details about the patient encounter PAT_ENC_HSP: 1 row added; includes additional encounter details IP_FLWSHT_MEAS (Flowsheet Measurements; for vital signs): 7 rows added; includes BP systolic, BP diastolic, pulse, temp, RR, height, weight) SOCIAL_HX (Social History): 5 rows added; includes Jasmine’s tobacco, alcohol, cannabis, exercise, and sexual activity FAMILY_HX (Family History): 2 rows added; includes father’s diabetes and grandmother’s breast cancer ORDER_PROC (Orders): 5 rows added; one for each lab test ordered NOTE_ENC_INFO: 1 row added; connects Jasmine’s encounter to clinical free-text note ARPB_TRANSACTIONS: 1 row added for procedure code 99395 Additional metadata tables were modified that are not listed here. |
|---|---|
| Unstructured Data | HNO_INFO 1 row added with the metadata for the clinical note NOTE_TEXT 1 row added with the actual text of the note |
Multi-day Hospitalization
Robert Chen, a 67-year-old retired postal worker, arrives at the emergency department at 2:47 AM on a Tuesday morning via ambulance. His wife called 911 after finding him sitting upright in bed, gasping for air, with his lips appearing slightly blue. The paramedics note his oxygen saturation is 84% on room air, blood pressure 168/95, heart rate 112 and irregular, respiratory rate 28. They place him on 4 liters of oxygen via nasal cannula and establish IV access during transport.
Admission
Upon arrival, the ED registration clerk creates a new encounter in Epic while the triage nurse brings Robert directly to a critical care bay. She removes his shirt to place cardiac monitor leads and oxygen saturation probe, documenting his initial vital signs at 2:52 AM: blood pressure 172/98, heart rate 118 (irregular), respiratory rate 26, oxygen saturation 89% on 4 liters nasal cannula, temperature 98.1°F. She opens Epic’s ED flowsheet and documents his chief complaint as “shortness of breath,” marks his acuity as ESILevel 2 (Emergency Severity Index; 1 is the most severe and 5 the least severe).
Dr. Sarah Williams, the ED attending, enters the room at 2:58 AM. Robert, speaking in fragmented sentences between breaths, reports he’s had three days of progressive shortness of breath, worsening leg swelling, and has been sleeping propped up on four pillows. He ran out of his “water pill” two weeks ago and didn’t refill it. He has a history of heart failure, coronary artery disease with prior myocardial infarction (heart attack) in 2019, hypertension, type 2 diabetes, and a 40-pack-year smoking history though he quit five years ago. Current medications include metoprolol, lisinopril, atorvastatin, metformin, and furosemide. No known drug allergies.
The ED nurse draws blood at 3:05 AM for a complete blood count (to check red and white blood cells), a comprehensive metabolic panel (to check kidney function, electrolytes, and blood sugar), troponin (a protein that indicates heart muscle damage), and BNP (a hormone that shows how much strain the heart is under), and establishes a second IV line. A portable chest X-ray is performed at 3:12 AM showing fluid around both lungs and fluid inside the lung tissue itself. An electrocardiogram at 3:15 AM shows an irregular heart rhythm called atrial fibrillation with the heart beating too fast at 118 beats per minute. Dr. Williams orders furosemide 40 milligrams intravenously (diuretic given through the IV to help remove excess fluid), initiates a nitroglycerin drip (a medication that helps open up blood vessels and reduce the heart’s workload), and starts continuous heart monitoring. She places orders for a heart specialist to see Robert and for admission to the telemetry unit (a hospital floor where patients’ heart rhythms are monitored continuously).
Hospitalization
At 6:30 AM, after receiving diuretics and seeing improvement (O2 sat now 94% on 2L, respiratory rate 18), Robert is transferred to the 4th floor telemetry unit. The admitting hospitalist, Dr. James Martinez, receives a text page notification through Epic’s secure messaging system and heads to Robert’s room at 7:15 AM to perform an assessment.
Dr. Martinez sits on a rolling stool next to Robert’s bed, his smartphone recording the conversation. Robert reports feeling “much better” but still short of breath with minimal exertion. Dr. Martinez performs a comprehensive history and physical examination, noting 3+ pitting edema to the knees bilaterally, bibasilar crackles on lung auscultation, irregular heart rhythm, and a displaced point of maximal impulse. His jugular venous pressure is elevated at 12 cm. The physical exam findings suggest acute decompensated heart failure, likely precipitated by medication non-adherence and dietary indiscretion.
Throughout the morning, the telemetry nurse documents vital signs every 4 hours in Epic’s flowsheet: 8:00 AM (BP 145/88, HR 94, RR 16, O2 sat 96% on 2L), 12:00 PM (BP 138/82, HR 88, RR 14, O2 sat 97% on 2L). She records fluid intake and urine output meticulously, noting Robert has put out 1,200 mL of urine by noon after receiving two doses of IV furosemide. She weighs him daily at 6 AM using the bed scale, documenting 198.4 lbs on admission day and 194.2 lbs the following morning.
The cardiologist, Dr. Jennifer Park, evaluates Robert at 10:30 AM on hospital day 1. She opens Epic on a mobile workstation outside his room, reviews his echocardiogram from six months ago, observing an ejection fracture of 35% (meaning the heart is pumping only 35% of the blood it should be) and performs an examination. She dictates a consultation note using her voice recognition software directly into Epic, recommending uptitration of guideline-directed medical therapy, cardioversion consideration if he doesn’t convert to sinus rhythm, and reinforcement of medication adherence. She places orders for a repeat echocardiogram and adjusts his medication regimen to include spironolactone 25mg daily.
During Robert’s three-day hospitalization, a multidisciplinary care team documented his treatment in Epic through interconnected clinical notes including nursing assessments every shift monitoring respiratory status and edema, daily progress notes from Dr. Martinez tracking volume status and diuretic transition, pharmacy medication reconciliation, case management coordination of home health services and follow-up appointments, nutrition consultation for low-sodium diet education with 2-liter fluid restriction, and physical therapy clearance for home discharge. The telemetry system transmitted continuous cardiac monitoring to Epic’s flowsheets while HL7 interfaces automatically populated lab results showing improving clinical markers: BNP decreasing from 1,847 to 892, troponin normalizing from 0.08 to unmeasured levels, and stable renal function with creatinine around 1.0-1.1 and potassium maintained between 3.8-4.3. Robert converted to normal sinus rhythm on day 2 with metoprolol rate control, and his repeat echocardiogram demonstrated stable systolic function at 35% ejection fraction with moderate mitral regurgitation and no pericardial effusion.
Discharge
On hospital day 4, Dr. Martinez determines Robert is ready for discharge. He opens Epic’s discharge navigator workflow at 10:45 AM and begins completing the discharge summary. The ambient scribe’s draft notes from each day populate sections of the discharge summary automatically, which he reviews and edits for accuracy.
At 11:30 AM, Dr. Martinez enters Robert’s room with his smartphone recording. He explains the discharge plan: continue oral furosemide 40mg twice daily, increase lisinopril to 10mg daily, continue metoprolol 50mg twice daily, add spironolactone 25mg daily, and maintain his statin and metformin. He counsels on smoking cessation maintenance (Robert quit 5 years ago but the history remains relevant), daily weights with instructions to call if weight increases more than 3 pounds in a day, dietary sodium restriction to less than 2 grams daily, and fluid restriction to 2 liters daily.
The case manager schedules follow-up appointments: cardiology in 1 week, primary care in 2 weeks. Home health nursing is arranged for twice-weekly visits to monitor weights, blood pressure, and medication compliance. Prescriptions are sent electronically to Robert’s preferred pharmacy via Epic’s e-prescribing system at 12:15 PM.
The discharge nurse reviews all medications with Robert and his wife at 1:30 PM, providing printed medication lists and instructions. She documents completion of discharge education in Epic’s discharge teaching flowsheet. Robert’s IV lines are removed, discharge orders are signed by Dr. Martinez at 2:05 PM, and Robert leaves the hospital with his wife at 2:45 PM.
At 8:30 PM that evening, Dr. Martinez completes his final discharge summary documentation. He opens the AI-generated draft on his home computer, which has populated the hospital course based on his daily ambient scribe recordings. He adds specific details about physical exam findings not captured verbally (such as “no hepatomegaly” and “2/6 systolic murmur at apex”), verifies medication dosing is correct, ensures all lab values and imaging results are accurately reflected, and finalizes the assessment and plan sections. He adds his diagnostic impression: “Acute decompensated heart failure, precipitated by medication non-adherence, with rapid atrial fibrillation that converted to normal sinus rhythm with rate control.”
He electronically signs and locks the discharge summary at 8:52 PM. The encounter is coded as DRG 291 (Heart Failure & Shock with MCC) by the hospital’s coding team the following morning after reviewing the complete documentation. The final bill includes charges for four days of telemetry monitoring, laboratory studies, imaging, cardiology consultation, pharmacy services, case management, dietary consultation, and physician services totaling $34,847 before insurance adjustments.
Data Created by Robert’s Hospitalization
Robert’s four-day hospitalization for acute decompensated heart failure generated extensive documentation across Epic’s data architecture, with over 250 rows of structured data captured in relational database tables and more than 20 unstructured clinical notes stored separately.
| Structured Data Epic Clarity Data Warehouse | PAT_ENC 1 row added; includes basic details about the emergency department encounter starting at 2:47 AM PAT_ENC_HSP 1 row added; includes additional encounter details including admission from ED to telemetry unit, 4-day length of stay, and discharge disposition IP_FLWSHT_REC (Flowsheet Records) Multiple rows added for each vital sign documentation session throughout the 4-day hospitalization IP_FLWSHT_MEAS (Flowsheet Measurements) Approximately 120+ rows added; includes vital signs documented every 4 hours in telemetry unit (blood pressure systolic, blood pressure diastolic, heart rate, respiratory rate, oxygen saturation, temperature), daily weights, fluid intake/output measurements PAT_ENC_DEPT_HX (Department History) 2 rows added; tracks Robert’s movement from emergency department to telemetry unit ORDER_PROC (Procedure Orders) 15+ rows added; includes initial ED lab orders (complete blood count, comprehensive metabolic panel, troponin, BNP), chest X-ray, electrocardiogram, repeat echocardiogram, daily labs on hospital days 1-3, cardiology consultation order ORDER_MED (Medication Orders) 10+ rows added; includes ED medications (furosemide IV, nitroglycerin drip), admission medications (metoprolol, lisinopril, atorvastatin, metformin), new medications (spironolactone), transition from IV to oral furosemide, discharge prescriptions MAR_ADMIN_INFO (Medication Administration Records) 40+ rows added; documents each time nurses administered medications throughout the 4-day stay LAB_RESULTS (Laboratory Results) 30+ rows added; includes all individual lab test results from admission labs and daily monitoring (BNP, troponin, creatinine, potassium, sodium, glucose, complete blood counts) ORDER_IMAGING (Imaging Orders) 2 rows added; portable chest X-ray in ED, repeat echocardiogram on hospital day 1 IMAGING_EXAM_INFO (Imaging Results) 2 rows added; includes chest X-ray findings (bilateral pleural effusions, pulmonary edema) and echocardiogram results (ejection fraction 35%, moderate mitral regurgitation) ORDER_DIAGNOSTICS (Diagnostic Tests) 1 row added; electrocardiogram order and interpretation PROBLEM_LIST 5 rows added or updated; acute decompensated heart failure (new), atrial fibrillation with rapid ventricular response (new or updated), heart failure with reduced ejection fraction (existing), coronary artery disease (existing), type 2 diabetes (existing) CLARITY_ADT (Admission/Discharge/Transfer) 3 rows added; ED arrival, admission to telemetry unit, discharge to home NOTE_ENC_INFO 20+ rows added; connects Robert’s encounter to all clinical documentation (ED physician note, cardiology consultation, daily progress notes, nursing shift notes, pharmacy notes, case management notes, nutrition consult, physical therapy evaluation, discharge summary) RX_ORDERS (Prescription Orders) 5 rows added; electronic prescriptions sent to pharmacy for discharge medications ARPB_TRANSACTIONS (Professional Billing Transactions) Multiple rows added; includes charges for ED physician services, hospitalist daily visits, cardiology consultation, nursing care, pharmacy services, case management, dietary consultation HSP_ACCT_DX_LIST (Hospital Account Diagnosis List) 1 row added for principal diagnosis: acute decompensated heart failure 3+ rows added for secondary diagnoses: atrial fibrillation, chronic systolic heart failure, coronary artery disease with history of myocardial infarction CLARITY_EAP_HOSP (Hospital Procedure Codes) 1 row added; DRG 291 (Heart Failure & Shock with Major Complications/Comorbidities) F_SCHED_APPT (Future Appointments) 2 rows added; cardiology follow-up in 1 week, primary care follow-up in 2 weeks HOME_HEALTH_ORDERS 1 row added; twice-weekly home health nursing visits for weight and blood pressure monitoring CLARITY_DEP (Department references) No new rows; existing records for emergency department and telemetry unit referenced IDENTITY_ID (Provider information) No new rows; existing records for Dr. Williams (ED attending), Dr. Martinez (hospitalist), Dr. Park (cardiologist) referenced Additional metadata tables were modified that are not listed here. |
|---|---|
| Unstructured Data | HNO_INFO 20+ rows added with metadata for each clinical note: Emergency department physician note (Dr. Williams) Admission history and physical (Dr. Martinez) Daily progress notes (Dr. Martinez, hospital days 1-4) Cardiology consultation note (Dr. Park) Nursing assessment notes (every 12-hour shift × 4 days = 8 notes) Pharmacy consultation notes Case management notes Nutrition consult note Physical therapy evaluation note Discharge summary (Dr. Martinez) NOTE_TEXT (or similar table containing actual note content) 20+ rows added with the actual text of all clinical notes listed above RADIOLOGY_REPORT_TEXT 2 rows added; narrative text of chest X-ray interpretation and echocardiogram report EKG_INTERPRETATION_TEXT 1 row added; narrative interpretation of electrocardiogram findings PATIENT_EDUCATION_TEXT Multiple rows added; documentation of education provided on heart failure management, medications, diet, fluid restriction, daily weights, when to seek medical attention |
Structured Data in EHRs
This section provides a detailed description of the structured data available in the EHR. These elements are presented in order of their typical usefulness to data scientists and researchers; laboratory results, for example, are presented first, are highly accurate, and offer deep insight into a patient’s conditions.
Laboratory Results
Laboratory tests are biological samples such as blood, urine, or other bodily fluids analyzed to measure specific compounds, cells, or organisms. Physicians order laboratory tests for a variety of reasons including diagnosing suspected diseases, monitoring known conditions, and assessing whether a treatment is working. Because the data is captured by machines and flows directly into EHRs, laboratory results represent one of the few data types where the EHR genuinely captures structured and accurate information.
Laboratory testing occurs across all healthcare settings, though with dramatically different frequencies. 98% of inpatient stays include at least one laboratory test, as clinicians need baseline values, monitor disease progression, and track treatment response. Emergency departments test about 56% of patients, prioritizing those with acute symptoms requiring rapid diagnosis. Outpatient visits have the lowest testing rate at just 29%, since many visits address minor complaints, medication refills, or preventive care that doesn’t warrant lab work.The sheer volume of outpatient encounters means they’re responsible for a substantial share of total lab utilization even though most individual visits don’t involve testing. There are between 4 and 5 billion laboratory tests performed each year in the United States, making them the most common medical procedure in healthcare.
The table below presents a sample of laboratory data from the famed MIMIC dataset, which has been the most commonly used open-source sample of EHR data for more than a decade. This sample has the foundational data elements that typically accompany labs:
| subject_id | specimen_id | lab_name | fluid | valuenum | ref_range_low | ref_range_high | valueuom | flag |
|---|---|---|---|---|---|---|---|---|
| 10002013 | 93257536 | MCH | Blood | 33.5 | 27 | 32 | pg | abnormal |
| 10002013 | 93257536 | MCHC | Blood | 35.2 | 31 | 35 | % | abnormal |
| 10002013 | 93257536 | MCV | Blood | 95 | 82 | 98 | fL | |
| 10002013 | 93257536 | Platelet Count | Blood | 242 | 150 | 440 | K/uL | |
| 10002013 | 93257536 | RDW | Blood | 12.8 | 10.5 | 15.5 | % | |
| 10002013 | 93257536 | Red Blood Cells | Blood | 3.74 | 4.2 | 5.4 | m/uL | abnormal |
| 10002013 | 93257536 | White Blood Cells | Blood | 10.1 | 4 | 11 | K/uL |
Subject_id: The unique identifier of the patient.
specimen_id: The unique identifier of the collected specimen. Each vial of blood, for example, would have its own id.
lab_name: This typically represents the name of the lab that the doctor selected within their EHR. While this field sometimes is standardized to reflect a lab test name as encoded in LOINC (see Part 1), it can also be institution specific and thus require mapping to LOINC, as it is in the data below.
fluid: Knowing the type of sample is critical, as some biological compounds can be measured in multiple types of fluids and thus have distinct reference ranges.
valuenum: This is the actual test result. While this is typically a number, there are also often strings expressing some lower or upper bound on what is measurable by the test (e.g. ‘Undetectable’ or ‘>1000’).
ref_range_low: Typically the lower bound on the 95% confidence interval on the result in a healthy population.
ref_range_high: Typically the upper bound on the 95% confidence interval on the result in a healthy population.
valueuom: Also known as ‘Units’ or ‘Units of Measure’ (UOM), this field specifies how the numerical results
Unit of Measurement
Laboratory results are meaningless without their units and this data is not always standardized. This can be a challenge, because analytes such as glucose are often reported as mg/dL (milligrams per deciliter) in the US and mmol/L (millimoles per liter) internationally. As a result, analysts must be careful to avoid inconsistent units when aggregating lab data across institutions and geographies.
UCUM (Unified Code for Units of Measure) is the international standard for representing units in healthcare data and establishes a single canonical representation for each measurement type. Examples of UCUM codes are mg/dL for milligrams per deciliter or mmol/L for millimoles per liter. The UCUM standard is foundational to the HL7 FHIR interoperability standard as well as the LOINC terminology for lab results. While other standards for units exist, UCUM dominates modern healthcare data because it’s designed specifically for electronic systems.
Reference Ranges
Reference ranges accompany most laboratory tests and provide a range of expected values. For example, most labs report a reference range of roughly 4.0-5.6% for a hemoglobin A1C test measuring the percentage of sugar (glucose) in one’s blood. These ranges aren’t standardized, are generated by individual labs, and typically represent the 95% confidence interval of the lab value within a healthy population. As a result, it is expected that 5% of healthy individuals fall outside the reference range for a given test. Ideally reference ranges are conditional on a patient’s age and gender, but often they are generalized within an adult population (typically 18-65 years old).
Medical Devices
The devices on hospital wards and in surgical suites generate rich physiological data from multiple types of sensors. Ventilators track every breath, infusion pumps record every milliliter of drug delivered, and bedside monitors capture thousands of heartbeats throughout a patient’s stay. Yet only a portion of this data flows into structured EHR fields accessible to analysts and applications. As of 2026, the data typically lives within manufacturer silos and thus clinicians often review real-time waveforms on device screens or PDF printouts, and then draft free-text notes summarizing the data. However, there is hope that in the future this data will have greater interoperability and be available for analysis alongside routine laboratory tests and clinical diagnoses.
Bedside Physiological Monitors
Walk into any surgical suite or Intensive Care Unit (ICU) and you’ll see walls of monitors. The number of monitors and the modality of their sampling (e.g. blood pressure cuff vs. arterial catheter) is dependent on the acuity of the patient as well as the care setting (ER vs. outpatient surgery vs. ICU).
Electrocardiogram (ECG/EKG ) -Records the heart’s electrical activity through electrodes placed on the chest, arms, and legs, capturing the coordinated polarization of cardiac muscle that drives each heartbeat. A standard 12-lead ECG samples electrical signals at 500 Hz for about 10 seconds, producing waveforms that reveal the heart’s rhythm, conduction pathways, and evidence of ischemia or structural damage. ECGs enable diagnosis of life-threatening arrhythmias like ventricular fibrillation, myocardial infarctions requiring immediate intervention, conduction blocks that may need pacemakers, and left ventricular hypertrophy from longstanding hypertension.
Blood Pressure - Non-critically ill patients have blood pressure measured intermittently via automated cuffs placed around the arm while critically ill ICU patients often have arterial blood pressure (ABP) monitored continuously via a small catheter inserted directly into an artery, converting the mechanical pressure waves from heartbeats into continuous electrical signals. This invasive waveform reveals the shape and quality of each pulse, helping clinicians detect problems like decreased cardiac output, severe hypovolemia, or catheter malfunction.
Blood Oxygen Saturation (SpO2) - Measures blood oxygen saturation by shining red and infrared light through a fingertip and detecting how much light is absorbed by hemoglobin. These devices, called pulse oximeters, alert staff to patients experiencing respiratory distress. During surgery, anesthesiologists continuously monitor each patient’s oxygen saturation and adjust ventilation according to the real-time feedback provided by the pulse oximeter. Any SpO2 measurement below 90% is considered problematic and typically motivates a medical intervention.
Respiratory Rate - Measured in ICUs from one of three sources: impedance pneumography (measures changes in electrical impedance across the chest as it expands and contracts with breathing), capnography (detecting CO2 in exhaled breath for intubated patients), or sometimes from variations in arterial blood pressure. These automated measurements work reasonably well but are prone to measurement error from patient movement, shallow breathing, and cardiac oscillations for respirations. Respiratory rate matters clinically because it is a sensitive indicator of patient deterioration, as rapid breathing (tachypnea) often precedes cardiac arrest, respiratory failure, or septic shock.
Temperature - ICU patients have temperature monitored continuously via electronic probes inserted into body cavities that accurately measure core temperature. Non-intubated or less critically ill ICU patients may have intermittent measurements using standard ear or oral electronic thermometers every few hours. Temperature is a critical vital sign because fever signals infection or inflammation requiring treatment, while hypothermia indicates shock, environmental exposure, or metabolic crisis.
There are additional bedside monitors that are used less frequently and typically reserved for the highest acuity patients in ICUs.
Intracranial Pressure (ICP) - Measured via an intraventricular catheter, epidural sensor, or subdural bolt placed directly into the brain or its surrounding spaces. ICP monitoring is critical for patients with traumatic brain injury, cerebral edema after stroke, or other conditions where brain swelling is a concern. Normal ICP is 5-15 mmHg; elevations above 20 mmHg warrant intervention to prevent herniation and permanent neurological damage.
Pulmonary Artery Pressure (PAP) - Measured through a pulmonary artery catheter inserted through a central vein into the right heart chambers. This is most commonly used to monitor acute heart failure patients or patients experiencing septic shock.
Cerebral Oximetry (rSO2) - Uses near-infrared spectroscopy (NIRS) to measure regional oxygen saturation in brain tissue non-invasively. Sensors placed on the forehead detect light absorption by hemoglobin, providing a proxy for cerebral perfusion. Most common during cardiac surgery to detect inadequate brain oxygen delivery during cardiopulmonary bypass.
Most bedside monitors generate waveform data in proprietary formats specific to each manufacturer. DICOM waveforms provide a standardized format for storing and exchanging these continuous signals. Waveforms are contained in a Waveform Sequence within a DICOM dataset, with each multiplex group representing a set of channels synchronized at a common sampling frequency Pydicom. When captured in DICOM format, waveform samples are encoded with specifications for the number of bits stored per sample and are stored channel-interleaved (meaning all channels at sample 1, then all channels at sample 2, etc.) Innolitics. The standard supports various signal types—ECG, respiratory waveforms, hemodynamic curves, and audio. However, adoption remains incomplete: while the DICOM standard included rules for ECG waveforms starting in 2000, manufacturers were slow to implement it, with the first diagnostic ECG device supporting DICOM appearing in 2006 ResearchGate. In practice, bedside monitor data typically remains trapped in manufacturer-specific formats, with waveforms either manually exported as PDFs or converted to DICOM through third-party gateway software—creating a disconnect between the real-time clinical data streams and standardized archival formats.
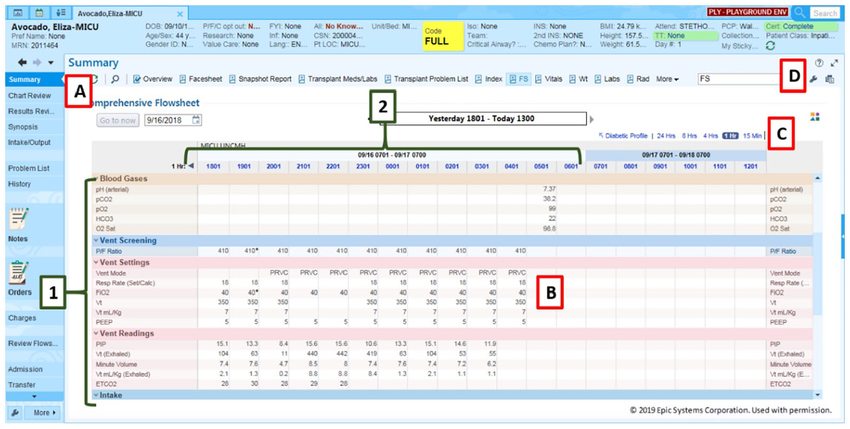
The massive number of data points from the physiological monitors are not automatically transferred into EHRs but rather are interpreted and then documented by nurses in EHR flowsheets. Flowsheets are tabular data entry interfaces in the EHR where clinicians document time-stamped observations to create structured longitudinal data. The use of flowsheets varies from monitoring vital signs to interviewing patients about drug and alcohol use. The data entry interface typically resembles a spreadsheet with time running down the rows (hourly, every 4 hours, or custom intervals) and measurement types across the columns (temperature, heart rate, blood pressure systolic/diastolic, respiratory rate, SpO2). Nurses click into cells to enter values, and the EHR enforces data type validation (numeric ranges, required fields, acceptable units) and some systems flag out-of-range values with color coding (e.g. red for critical). Modern flowsheets offer auto-population buttons that pull current values directly from interfaced bedside monitors, reducing transcription errors but also potentially importing errors if nurses don’t perform the necessary validation. Different hospitals configure their flowsheets differently; for example, some require documenting patient position and activity level in adjacent columns, others don’t capture this context at all. When you query vital signs or even patient-reported responses to a questionnaire from an EHR database, you’re likely extracting whatever made it into flowsheet cells during nurse documentation workflows.
Other Diagnostic Testing
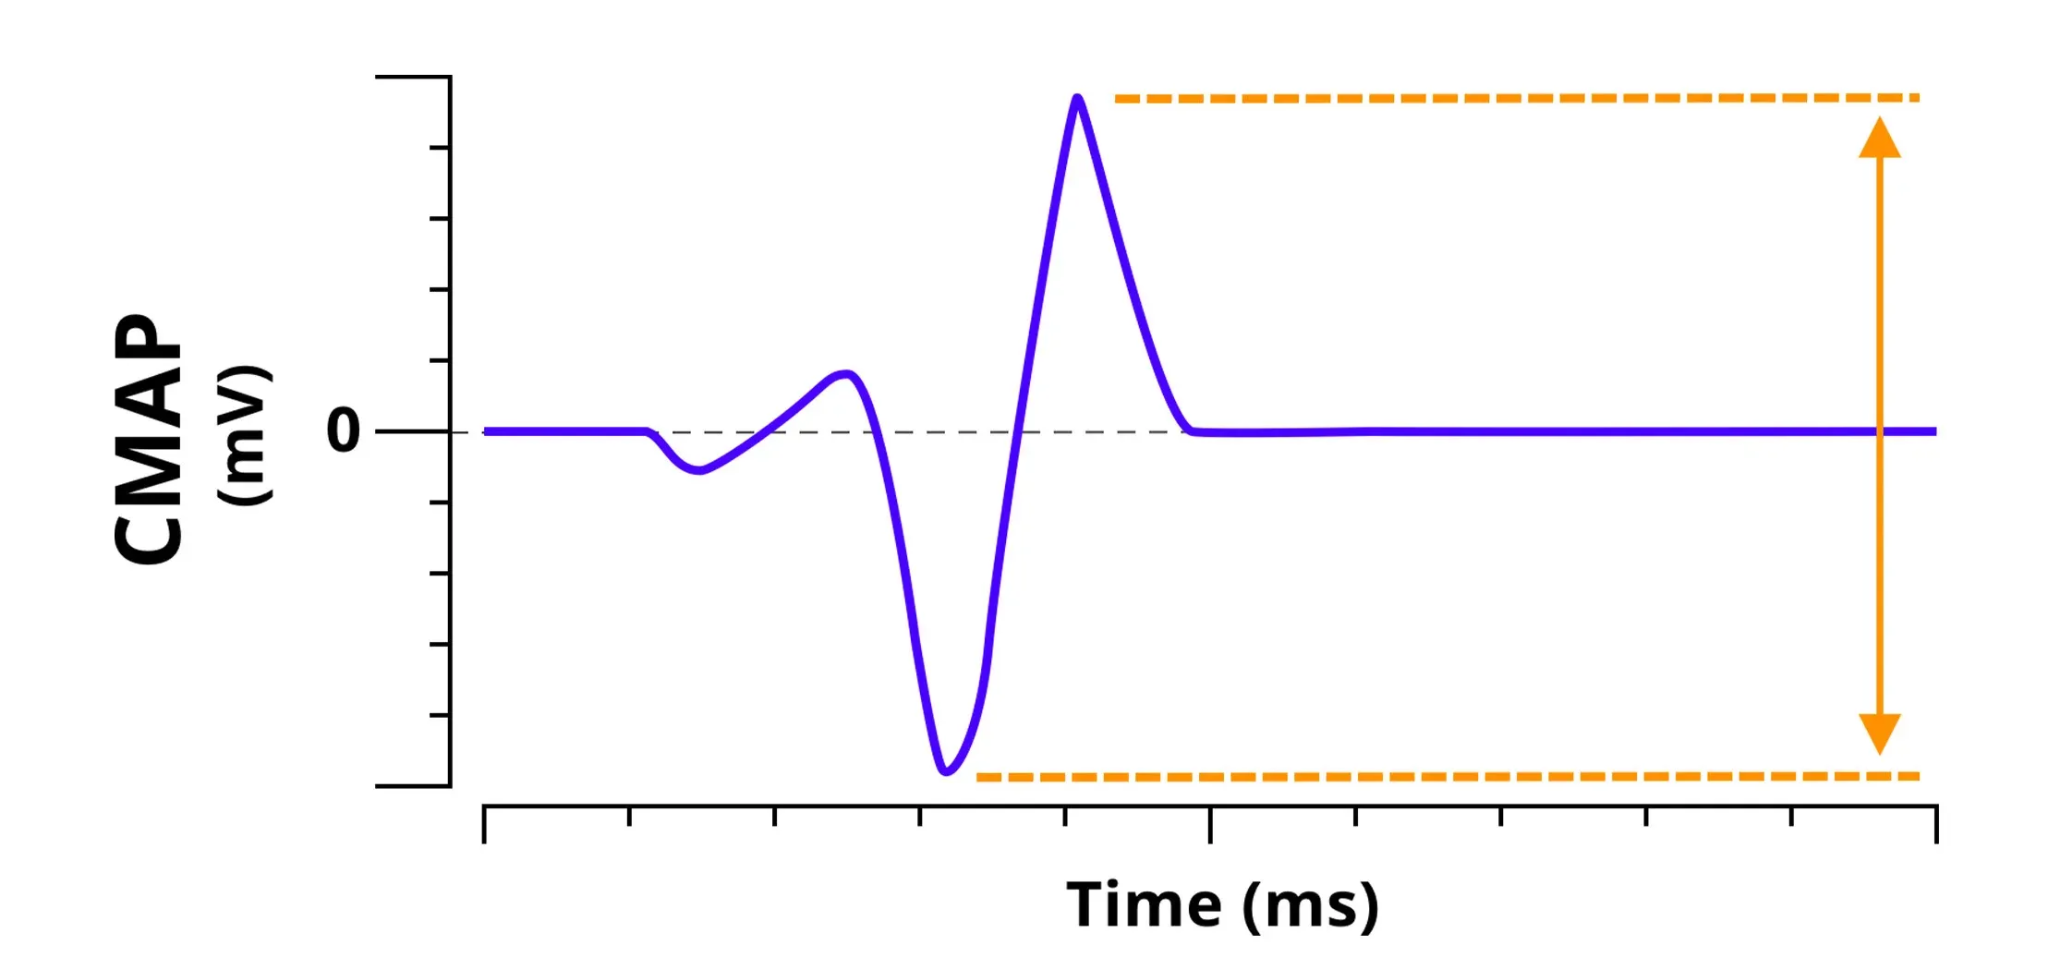
The nervous system within the human body is like the wiring in a house, with separate circuits for sending sensory information to the brain or and commands to muscles and organs. But electrical activity in the body isn’t confined to neurons, as cardiac and muscle cells can generate and propagate electrical signals independently. Electrophysiology (EP) data captures all of this electrical activity and is used by doctors to assess the functioning of the heart, brain, muscles, and nerves. This data consists of waveforms sampled hundreds or thousands of times per second, producing time-series data that can reveal normal and abnormal physiology. In electrophysiology specifically, waveforms show voltage measurements plotted continuously over time. The most common electrophysiology tests performed as as follows:
Electroencephalogram (EEG) - Standard for seizure diagnosis and monitoring epilepsy. Common in neurology but nowhere near ECG volumes. Routine EEGs take 30-60 minutes; extended monitoring can last days.
EMG/Nerve conduction studies - Common in neurology for diagnosing neuropathy, radiculopathy, carpal tunnel syndrome, and other nerve/muscle disorders. More specialized than ECG/EEG.
Sleep studies (Polysomnography) - Include EEG plus other sensors. Very common for sleep apnea diagnosis but require overnight stays in sleep labs or home testing equipment.
Cardiac Electrophysiology
Neurological Electrophysiology
Vital Signs
Vital signs in EHRs represent snapshots of physiological measurements captured at specific points in time rather than continuous monitoring data. In outpatient settings, medical assistants measure and manually enter vitals during patient rooming - typically one set per visit including blood pressure, heart rate, temperature, respiratory rate, height, weight, and sometimes oxygen saturation and pain score. These entries flow into structured fields with standardized LOINC codes and UCUM units, making them relatively clean for analysis. Inpatient vital signs follow a different pattern: nurses document measurements at regular intervals (every 4-6 hours on med-surg floors, every 1-2 hours in step-down units, every 15-60 minutes in ICUs), often transcribing values from bedside monitors into the EHR’s flowsheet documentation. While ICU monitors capture continuous waveforms sampled hundreds of times per second, only the nurse-validated periodic measurements make it into the structured database tables that researchers and analysts can access. The raw physiological waveforms that anesthesiologists watch during surgery or intensivists monitor in real-time almost never get stored in analyzable formats - they’re displayed, maybe printed to PDFs, but rarely preserved as time-series data.
Medication Orders
Problem Lists
Principal and Secondary Diagnoses
Diagnosis codes that are assigned as the principal and secondary diagnosis associated with a encounter are heavily concentrated in common, billable conditions. Providers won’t code “unstable living environment contributing to patient’s medication non-adherence”, they code “Type 2 diabetes mellitus without complications” because that’s what justifies the A1C order and the prescription refill. The diagnosis list in an EHR is better understood as “conditions that justified billable services” rather than “conditions the patient actually has.” Moreover, the timing of diagnoses is equally revealing. A patient might have had hypertension for years, but it only appears in their problem list when a physician needs to justify prescribing an antihypertensive or when a quality metric flags that the diagnosis should be documented.
Medication List
Caution is warranted when analyzing a patient’s medication list. The medication list shows what was prescribed, not what the patient is actually taking. A patient might be prescribed four different blood pressure medications, but if they can’t afford them or experience side effects, the prescriptions sit in the EHR as if they represent reality. The physician might not discover the non-adherence for months, and even then might not remove the medications from the active list because “we tried this once, might need to reference it later.” Over-the-counter medications, supplements, and drugs prescribed by other providers often don’t appear at all unless the patient happens to mention them and someone takes the time to enter them manually.
Social History
Diagnostic Test Orders
Family History
Adverse Reactions
Procedure Orders (CPT/HCPCS/DRGs)
Allergies
Immunization Records
Care Team Assignments
Semi-Structured Data in EHRs
Nursing Flowsheets
Unstructured Data in EHRs
Representing EHR data using Common Data Models
If you’ve spent any time working with healthcare data, you probably intuitively understand the need for a common data model. A common data model is a way to standardize the structure and content of data across different settings. If you are new to healthcare data, you will soon learn that hospitals, health systems, insurers, and other institutions typically store their data in formats all their own. When you are a researcher using observational data to study a disease or the effectiveness of a drug, it’ll be much harder to achieve your aims if the majority of your time is spent harmonizing data.
HL7 FHIR: Exchanging data between hospitals and health systems
OMOP: For research using EHR data
What is OMOP?
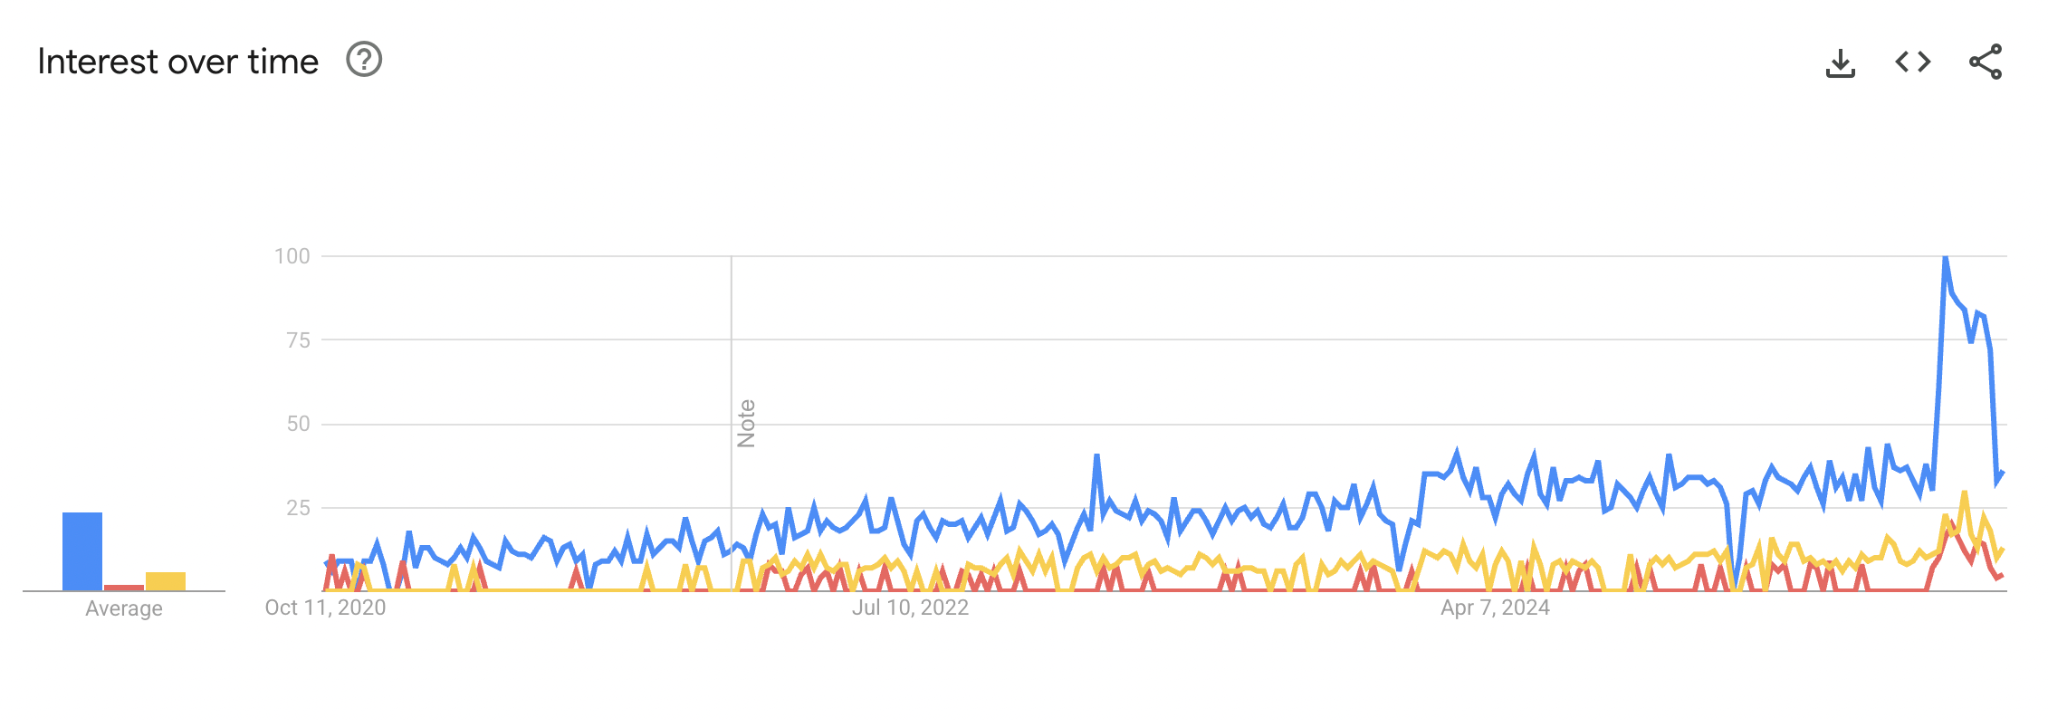
OMOP is a common data model for healthcare data generated in healthcare settings. OMOP is an acronym for the Observational Medical Outcomes Partnership, which was a partnership between the FDA, drug companies, and health systems in the early 2010s whose goal was to create infrastructure to study the effectiveness of medical products using observational data. Observational data is data that is collected outside of a controlled research study (and is different from clinical trial data). Since then, OMOP has increased in popularity compared to similar common data models focused on observational health data.
Understanding OMOP tables
Now that you understand why healthcare needs a common data model, let’s talk about how OMOP actually structures your data.Think of OMOP as a filing system that everyone agrees to use. If you and I both organize our healthcare data using the same filing system, then I can write a query once and run it against both of our databases. That’s the fundamental value proposition.
The OMOP data model consists of several dozen tables, but you can understand 80% of what matters by focusing on six core clinical tables:
Person - One row per patient. Demographics like birth year, gender, race, and ethnicity. No names or addresses—OMOP is designed for de-identified data.
Visit_Occurrence - Every time a patient interacts with the healthcare system. An emergency room visit, an outpatient appointment, an inpatient hospitalization. Each visit has a start date, end date, and visit type.
Condition_Occurrence - Diagnoses and problems. Every time a clinician documents that a patient has diabetes, hypertension, or a broken arm, it goes here.
Drug_Exposure - Medications. Prescriptions, administrations, dispensing events. Both inpatient medications and outpatient prescriptions.
Measurement - Lab tests and vital signs. Hemoglobin A1c results, blood pressure readings, COVID test results. Anything that produces a numeric or categorical measurement.
Procedure_Occurrence - Things done to patients. Surgeries, imaging studies, physical therapy sessions. If someone performed a procedure, it’s documented here.
These six tables handle the vast majority of clinical data. There are additional tables for things like observations, notes, specimens, and device exposures, but the pattern is the same: one table per broad category of clinical event.
Understanding OMOP’s vocabulary
Here’s where OMOP gets powerful but complex. It’s not enough to agree that all diagnoses go in the Condition_Occurrence table. We also need to agree on how to represent “Type 2 diabetes.”
In the wild, you’ll see Type 2 diabetes represented dozens of ways:
ICD-10 code E11.9 (most common in US billing)
ICD-9 code 250.00 (older US standard)
SNOMED-CT concept 44054006 (international clinical standard)
Textual Diagnoses: “T2DM”, “Type II DM”, “NIDDM”, “diabetes mellitus type 2”
OMOP solves this through a standardized vocabulary system. Every clinical concept in OMOP is represented by a concept_id—a unique integer that points to a standardized term. All of those variations above map to a single standard SNOMED-CT concept that OMOP recognizes as “Type 2 diabetes mellitus.”
The vocabulary tables (CONCEPT, CONCEPT_RELATIONSHIP, CONCEPT_ANCESTOR) store these mappings. When you load data into OMOP, your ETL process looks up the appropriate concept_id for each diagnosis, drug, lab test, and procedure. Then when you analyze the data, you query using these standardized concept_ids, and you can be confident you’re capturing all the variations.
This is the hardest part of building an OMOP database, and it’s where most implementations run into trouble. More on that later.
OMOP as a Healthcare Database Template
Here’s how I think about OMOP: it’s not software or a tool, it’s a database schema specification. It’s a blueprint that says “here’s how to structure your tables, here’s what columns each table should have, and here’s how they should relate to each other.”
When you “implement OMOP,” you’re taking that blueprint and:
Creating an empty database with the OMOP table structure
Loading the standardized vocabularies
Extracting data from your source systems (EHR, claims, etc.)
Transforming that data to match OMOP’s structure and vocabularies
Loading the transformed data into your OMOP database
Once you’ve done that, you have a database that looks like every other properly implemented OMOP database. That means:
Queries written for one OMOP database will work on another
Tools built for OMOP (like ATLAS, the OHDSI web-based analytics platform) will work on your database
Research studies using OMOP can easily add your data as a new site
When to use (and not to use) OMOP
Having more than a decade of experience with OMOP, I cannot provide a blanket recommendation to use OMOP as a common data model for storing clinical data. It is a perfectly useful data model for storing several different streams of data, especially if that data lacks a consistent terminology to represent one or more clinical events (SNOMED, LOINC, etc). However, if you are storing a more limited set of data without the need for significant mapping to controlled terminologies, it is likely not the best choice. In the following two paragraphs I share one experience where OMOP with a powerful tool and another where it became an unnecessary burden.
At Columbia’s medical center, having access to a mature OMOP database transformed my productivity as a researcher. Instead of spending months deciphering messy data dictionaries and hunting across dozens of tables, I could query standardized structures where all lab tests lived in a single Measurements table and all diagnoses followed consistent vocabularies. The research IT team had already done the hard work of mapping local codes to standard terminologies and resolving semantic conflicts between source systems, which meant I could skip data engineering entirely and focus on feature engineering and modeling. OMOP databases are de-identified by design, making access easier for researchers, and the OHDSI community’s open-source tools automatically generate SQL queries that work across any properly implemented OMOP instance. This was an enormous privilege that I didn’t fully appreciate until later experiences showed me how rare it is.
When I joined a Series A health tech startup to build their analytics infrastructure, we chose OMOP because we anticipated ingesting EHR data, wearables, and insurance claims. We spent weeks setting up PostgreSQL with the full 40+ table OMOP schema and building complex Python ETL pipelines to map claims data through OMOP’s foreign key relationships and standardized vocabularies. As the business matured, we realized we’d primarily work with insurance claims—flat CSV files that just needed column name standardization and light cleaning. OMOP’s elaborate schema was overkill for what amounted to simple field mapping. After two years we abandoned it for a purpose-built claims model with a single table (one row per claim). If we were building this data stack today, I’d simply have used the Tuva Project’s pre-built medical claims data model with DBT. The Tuva Project is an incredible resource for data engineering and provides ready-made table structures specifically designed for healthcare data, eliminating the need to build complex ETL pipelines from scratch. Instead of spending weeks setting up OMOP’s 40+ tables and writing custom Python code, we could have used Tuva’s streamlined claims schema and transformation logic out of the box—a solution that’s purpose-built for exactly our use case.