Fitness Trackers
Smartphone manufacturers originally added accelerometers to enable automatic screen rotation between portrait and landscape modes. These sensors turned out to be sensitive enough to count steps by detecting the rhythmic vertical acceleration associated with human walking, which manufacturers like Apple and Samsung began tracking through health apps in the early 2010s. The ubiquity of smartphones quickly led to hopes that they would be a panacea for tracking physical activity and motivating people to get 10,000 steps and more generally increase their physical activity. As a result, insurance companies started offering lower premiums in exchange for their members hitting physical activity goals, until they realized that people were putting their Fitbits onto their dogs or on their ceiling fans.
How Fitness Trackers Work
Accelerometers measure acceleration in units called “g’s”, the same force that Katy Perry didn’t feel when she went to space in Jeff Bezo’s space capsule. One g equals the constant pull of Earth’s gravity and thus the baseline measurement of an accelerometer when it isn’t moving is +1g. Here’s what a stream of raw data might look like if you logged it while holding an iPhone still on a table:
| timestamp: 197914.039694875, x: 0.15, y: -0.38, z: -1.01 timestamp: 197914.139521333, x: 0.14, y: -0.39, z: -1.02 timestamp: 197914.239447791, x: 0.16, y: -0.37, z: -1.00 timestamp: 197914.339374249, x: 0.15, y: -0.38, z: -1.01 | | — |
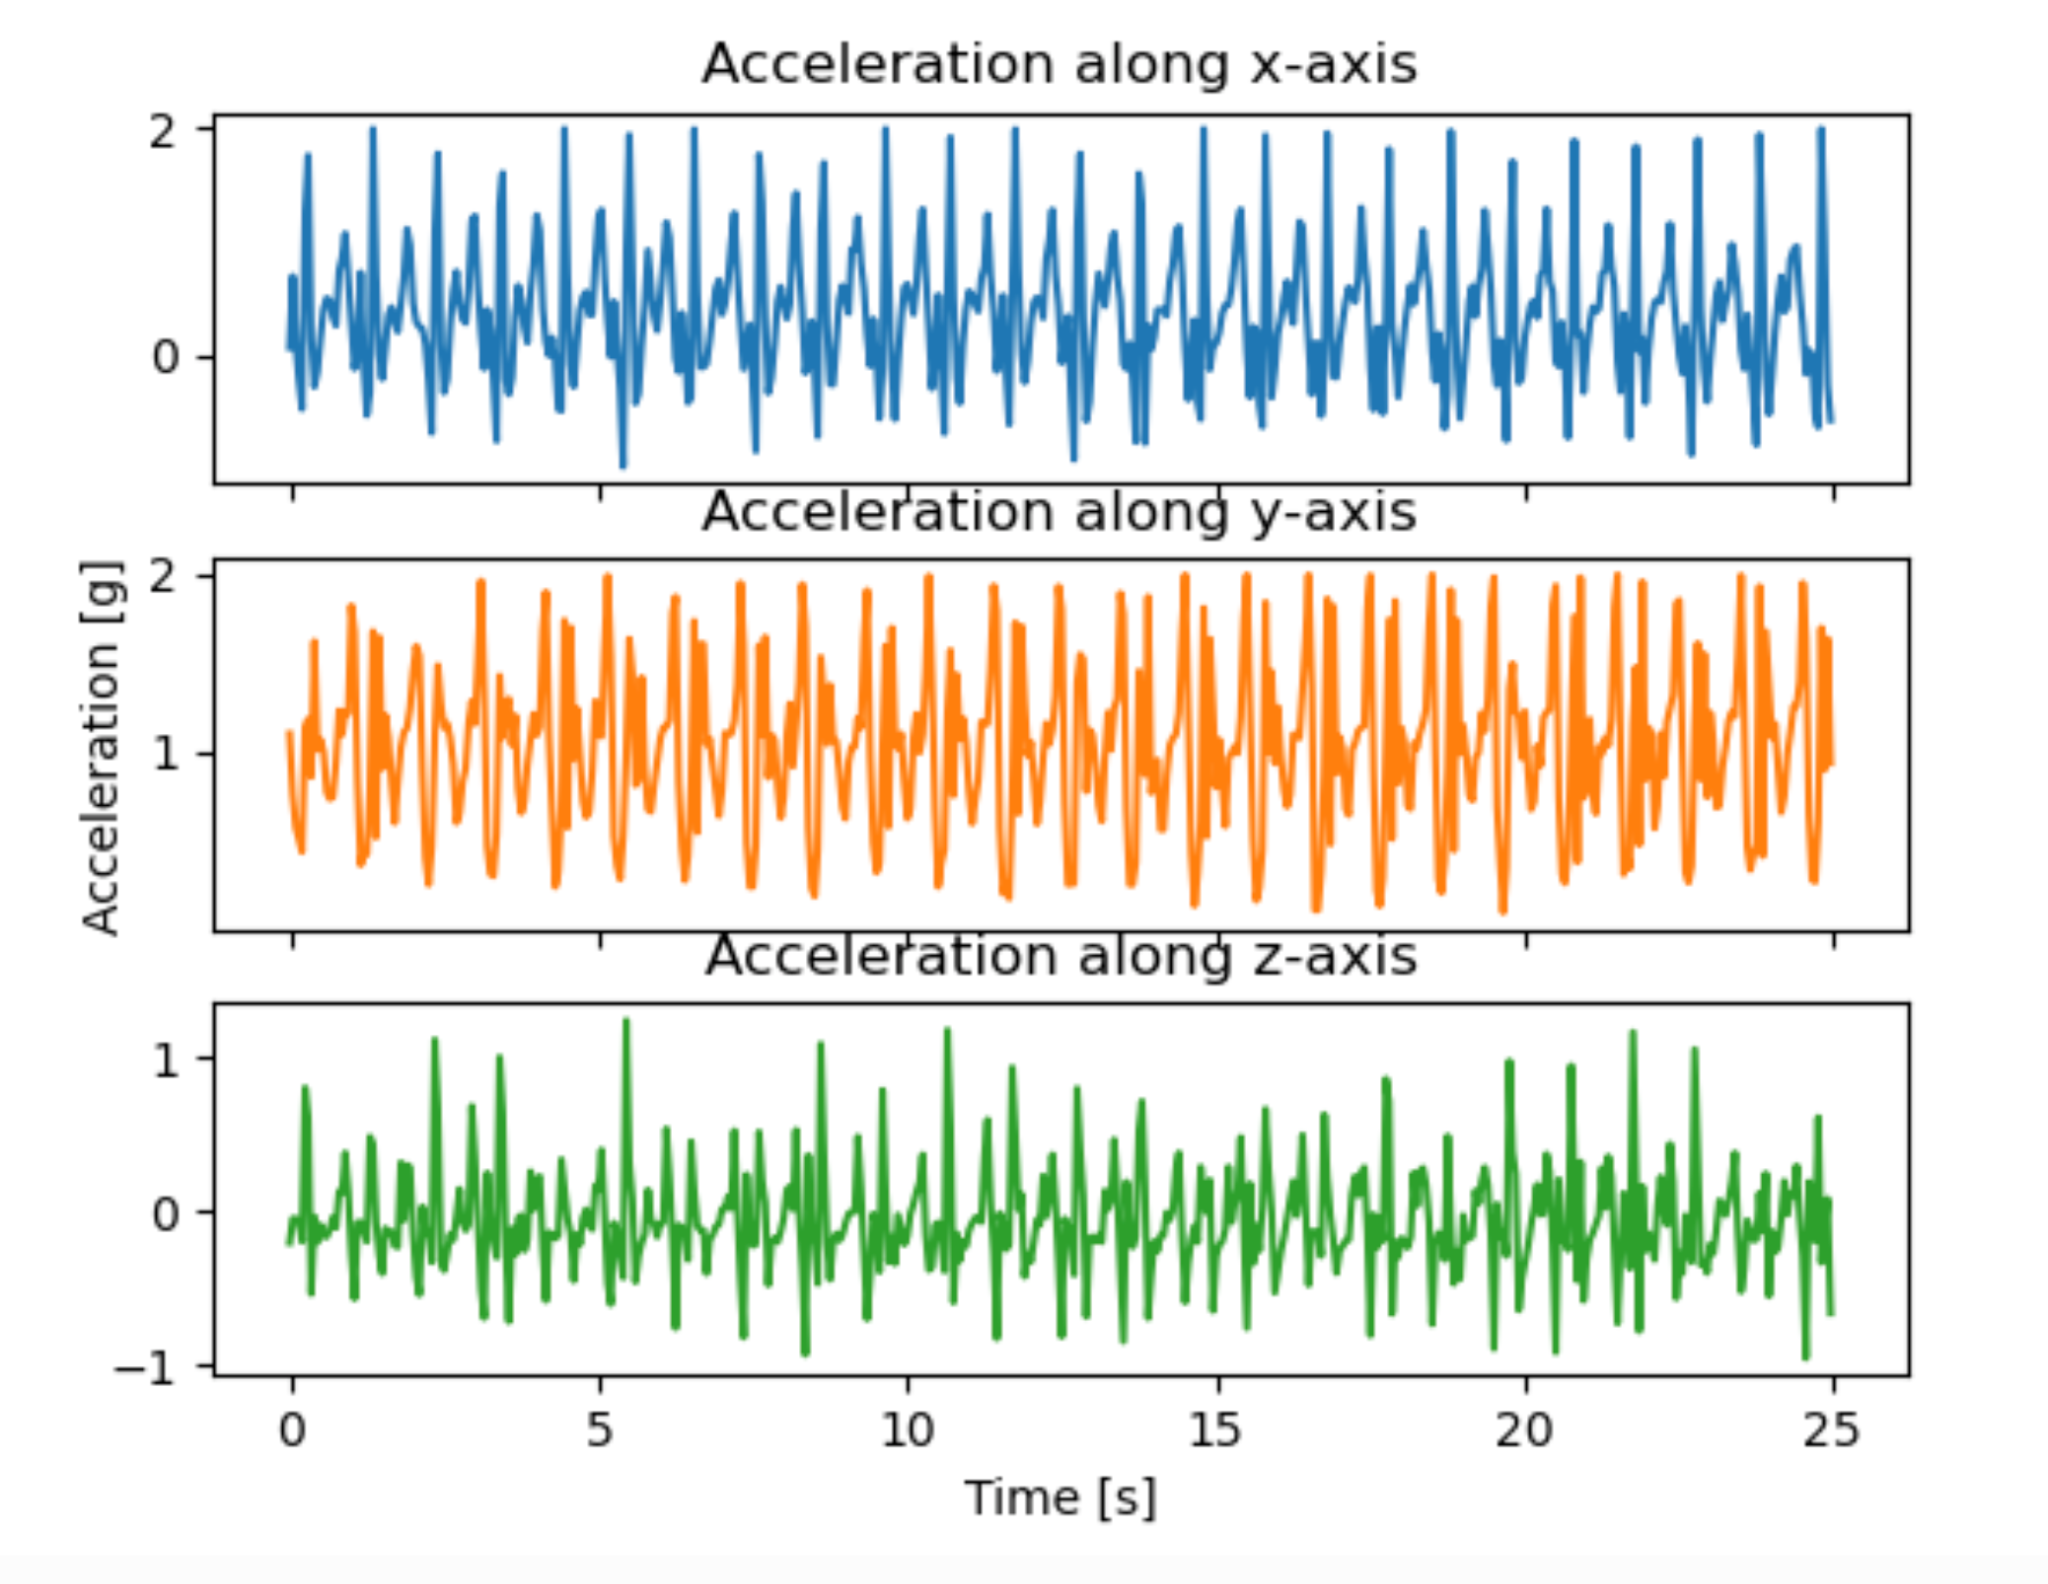
Each data sample contains four values: a timestamp (in seconds since device boot) and three acceleration measurements for x, y, and z axes. The values are expressed in g’s (multiples of Earth’s gravity): if your phone is lying flat with the screen facing up, the z-axis reads around -1.0 (or 1g downward); if lying screen down, it reads around +1.0; if balanced on its left side, the x-axis reads -1.0. These values recorded represent the sum of all accelerations measured across some time frame; developers typically request updates at 10 Hz (10 samples per second) although most devices can log data at 100 Hz (100 samples per second). The timestamp uses an arbitrary reference point (device boot time) rather than wall-clock time, so you can’t directly compare timestamps across different devices or sessions. The figure below represents a time series of accelerometer data from a smartphone in a pocket across 25 seconds while an individual was walking at a moderate pace.
How To Access Data From Fitness Trackers
Most major fitness tracker platforms expose OAuth 2.0 APIs that let developers programmatically access user data after obtaining consent. Fitbit’s Web API, Garmin’s Health API, and Apple’s HealthKit framework all follow similar patterns: users authenticate through the manufacturer’s login page, grant your app specific permissions (steps, heart rate, sleep, etc.), and you receive an access token to make REST API calls. In contrast, Apple’s data stays on-device and requires a native iOS app rather than web API calls but authorization is similar to other frameworks. Rate limits vary by manufacturer and you’ll need to handle token refresh logic since access tokens typically expire after several hours to a few days.
For research studies, you have two main options: build a participant-facing app that pulls data through these APIs, or request bulk de-identified datasets directly from manufacturers. The first approach gives you granular control and works well for smaller studies (n<1000), but expect 20-30% participant dropout due to authentication friction and the ongoing burden of keeping apps connected. The second approach can provide cleaned, de-identified data at scale but requires institutional partnerships with manufacturers like FitBit and Garmin and takes months to arrange, and often comes with publication restrictions.
Regardless of how you access data from fitness trackers, significant data harmonization work will be necessary. Distinct algorithms are deployed by the likes of Fitbit, Apple, and other device manufacturers for calculating step count, heart rate, and sleep stage classifications. As of 2026, the integration of this data typically requires custom ETLs, as no open-source solution for harmonization of fitness tracker data exists. The closest thing to a solution would be building on Android’s Health Connect API, which Google is pushing as a unifying layer.
Sleep Monitoring
Consumer sleep tracking exploded after Fitbit added sleep detection to their devices in 2009, transforming what was once the exclusive domain of sleep labs into something millions now monitor nightly from their wrists. Modern sleep trackers combine data from accelerometers and optical sensors to combine movement and heart rate data and classify sleep into stages—light, deep, REM, and awake. Devices such as the Apple Watch and Oura Ring have made sleep tracking ubiquitous among health-conscious consumers and generate detailed sleep charts that suggest clinical-grade insights. But there’s a critical gap between what these devices show and what physicians can use, as validation studies demonstrate that consumer devices misclassify sleep stages 20-30% of the time compared to results from medical-grade sleep studies.
How Sleep Tracking Works
During sleep, your body cycles through light sleep, deep sleep, and REM sleep. Light sleep serves as a transition state and helps with memory consolidation, deep sleep drives physical restoration (tissue repair, immune function, and hormone release), and REM sleep handles emotional processing, procedural memory consolidation, and brain development. Each of these sleep stages is associated with distinct physiological patterns:
Light sleep: the accelerometer shows minimal movement with occasional small shifts as the person adjusts their position, while heart rate gradually decreases from waking levels and becomes more regular (less variability).
Deep sleep: the accelerometer shows nearly complete stillness while heart rate is 10-30% below resting with minimal heart rate variability and slow, rhythmic patterns.
REM sleep: the accelerometer registers almost no body movement, but heart rate and heart rate variability increase to levels similar to being awake, often with irregular spikes.
While deep sleep has a distinctive signature distinguishing light sleep from REM is more challenging. Both stages show minimal body movement on the accelerometer, and their heart rate patterns can look similar, with REM sometimes producing the elevated and irregular heart rates similar to those in restless light sleep or brief awakenings. The figure below shows the amount of noise observed in heart rate and accelerometer readings.
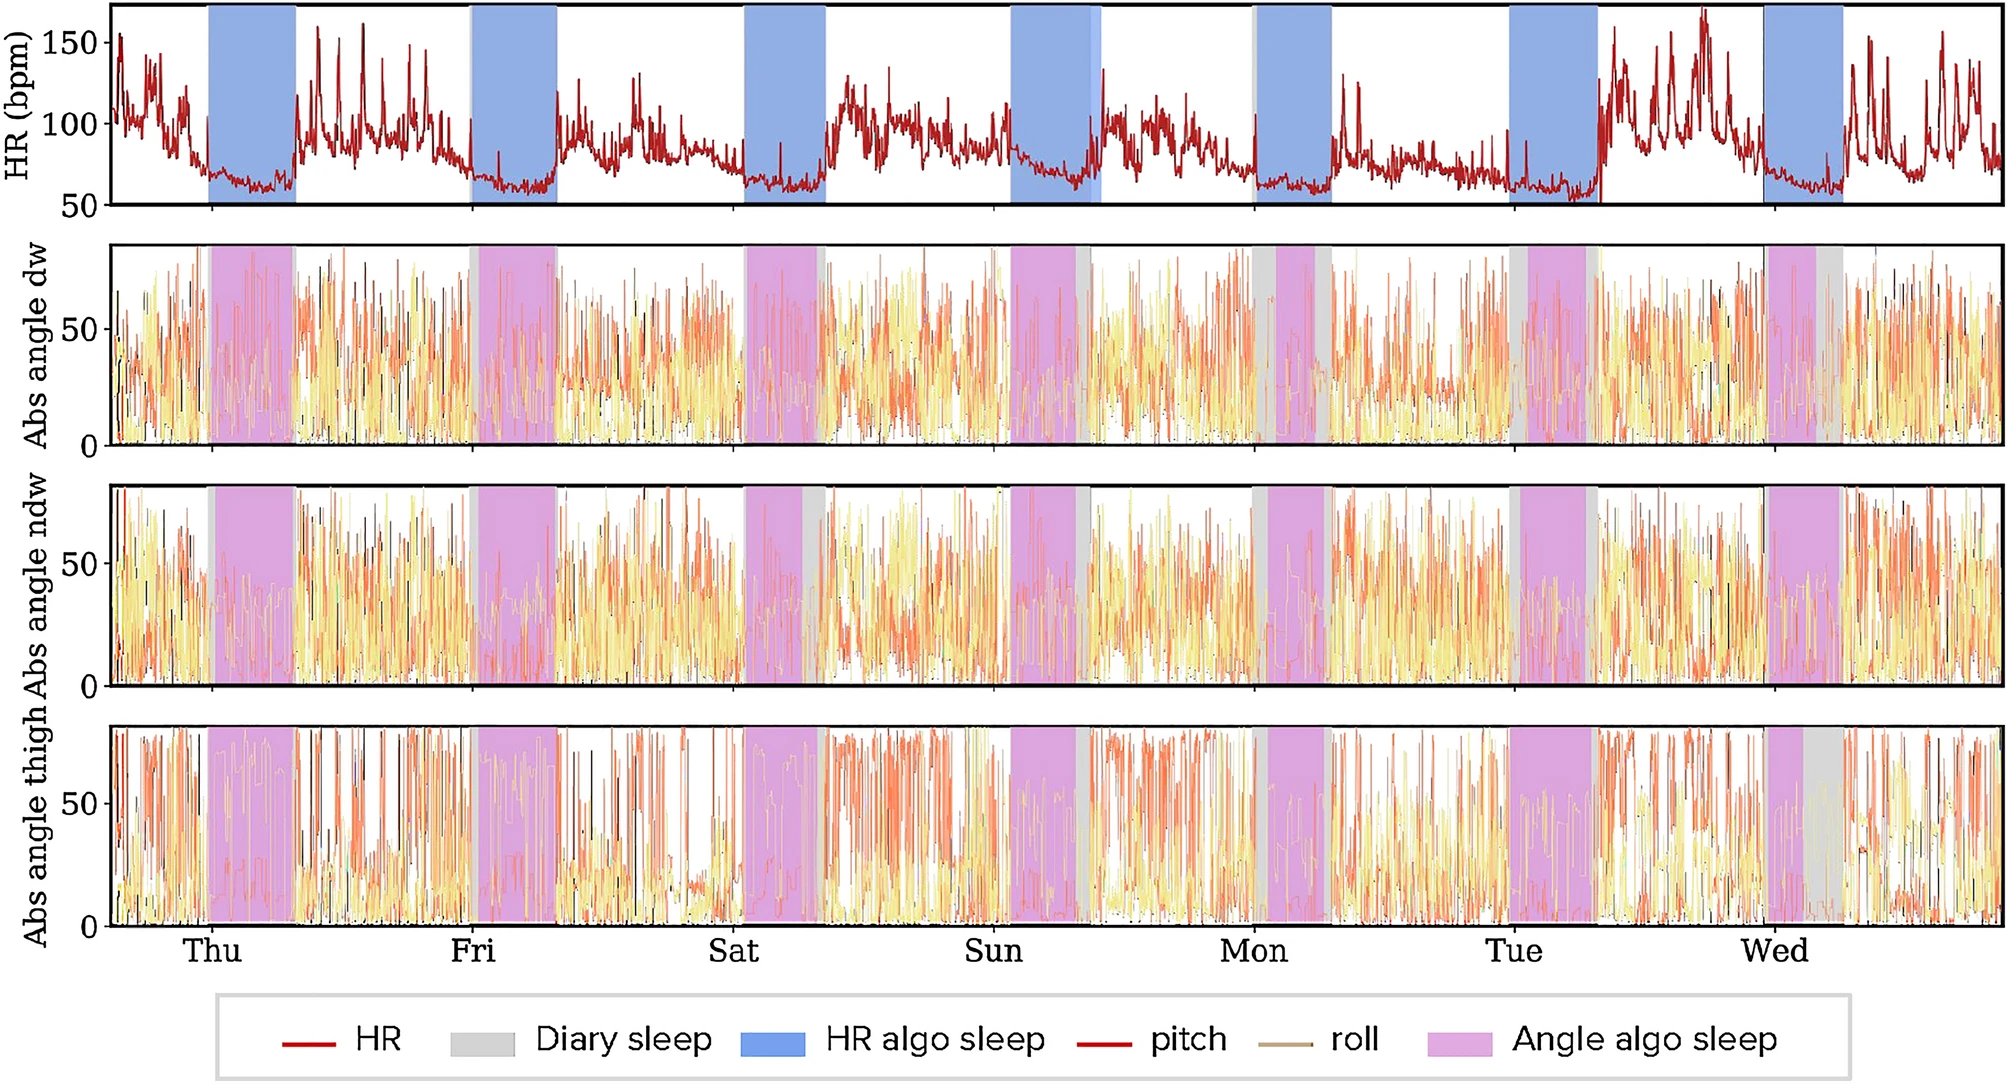
The lack of explicit differences in movement and heart rate across the sleep stages are why consumer devices can only achieve 60-70% accuracy for sleep stage classification compared to clinical polysomnography, which directly measures brain waves, tracks eye movements during REM, and uses chin muscle sensors to detect the characteristic muscle paralysis that confirms REM sleep.